I covered the Angular Devtools extension in a newsletter entry last year, and this browser extension keeps getting better and better.
For instance, with Angular 17, an injector tree view feature was added.
With the addition of signals to the framework, we get even better insights and access to our data in a static way that doesn’t require any breakpoint. For instance, if you want to see what’s the current value of a signal in one of your components, the extension shows that value:
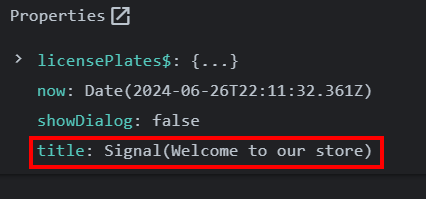
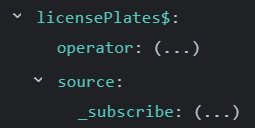
We can tell right away that title is a Signal and that the current value is “Welcome to our store”. With Observables, we don’t have that luxury:
So that’s one more good reason to use signals in our Angular applications and perhaps one more reason to try the official Angular dev tools extension if you haven’t done so yet.
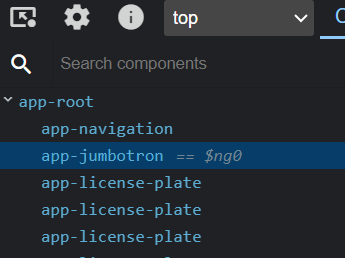
Another cool feature is that when you select a component in the tree view, you can see the text "== $ng0" showing up next to the component name:
This $ng0 is a variable that can be explored in the browser’s console. If I type $ng0 there, here’s what I get:
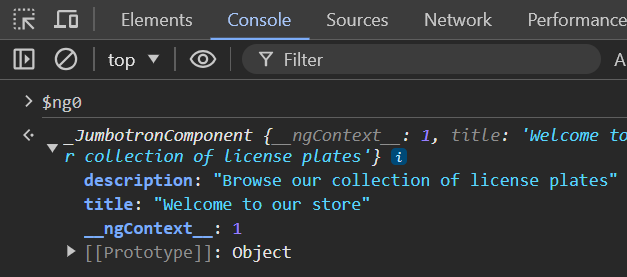
I can explore that component and any service injected into it right from the browser’s console—no breakpoint is needed.
Bonus tip: If you selected another component previously, it is now known as $ng1. The one before that, $ng2, and so on.