Updates, debugging, and performance

This week, I want to experiment with a slightly different newsletter format inspired by James Clear’s 3-2-1 weekly newsletter. My goal is to give you three quick updates about the Angular ecosystem, two short topics to revisit, and one question to make you think differently about the code you work with daily.

Three updates to know about:

Two short articles to revisit:

How to use the Angular Devtools browser extension and the ng namespace functions for debugging.

One question to think about:

Do you know the size of your build output and regularly check or update your build budgets?

Let me know what you think about this different newsletter format. As always, it remains short and to the point.
Debugging without breakpoints

I covered the Angular Devtools extension in a newsletter entry last year, and this browser extension keeps getting better and better.

For instance, with Angular 17, an injector tree view feature was added.

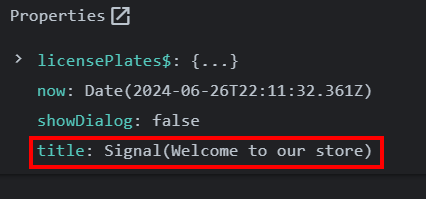
With the addition of signals to the framework, we get even better insights and access to our data in a static way that doesn’t require any breakpoint. For instance, if you want to see what’s the current value of a signal in one of your components, the extension shows that value:

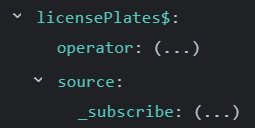
We can tell right away that title is a Signal and that the current value is “Welcome to our store”. With Observables, we don’t have that luxury:

So that’s one more good reason to use signals in our Angular applications and perhaps one more reason to try the official Angular dev tools extension if you haven’t done so yet.

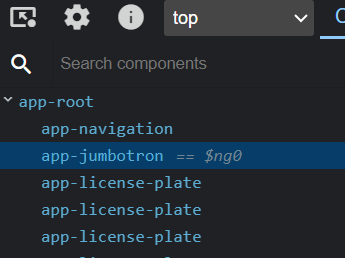
Another cool feature is that when you select a component in the tree view, you can see the text "== $ng0" showing up next to the component name:

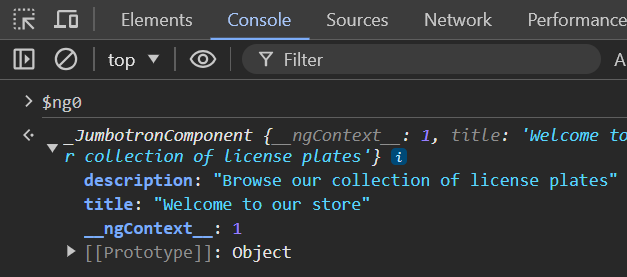
This $ng0 is a variable that can be explored in the browser’s console. If I type $ng0 there, here’s what I get:

I can explore that component and any service injected into it right from the browser’s console—no breakpoint is needed.

Bonus tip: If you selected another component previously, it is now known as $ng1. The one before that, $ng2, and so on.

Angular 17: New devtools injector tree view

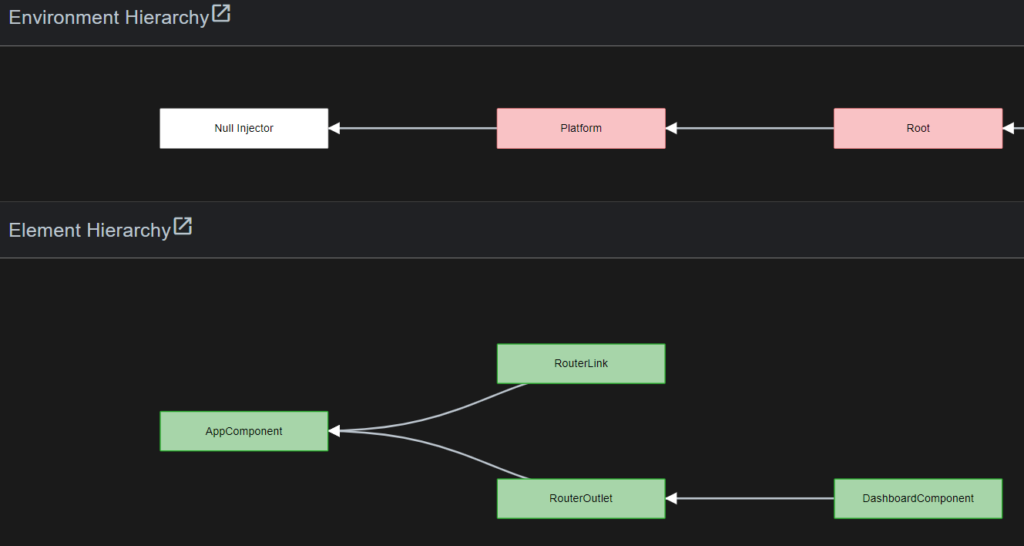
Another Angular 17 update is the release of a new DevTools panel called Injector Tree. It’s a good option to visualize both your element hierarchy and injector hierarchy, and it is accessible as a third tab in the Angular DevTools browser extension available for Chrome, Firefox, and Edge:

When we click on that tab, a tree view of all hierarchies shows up on the screen:

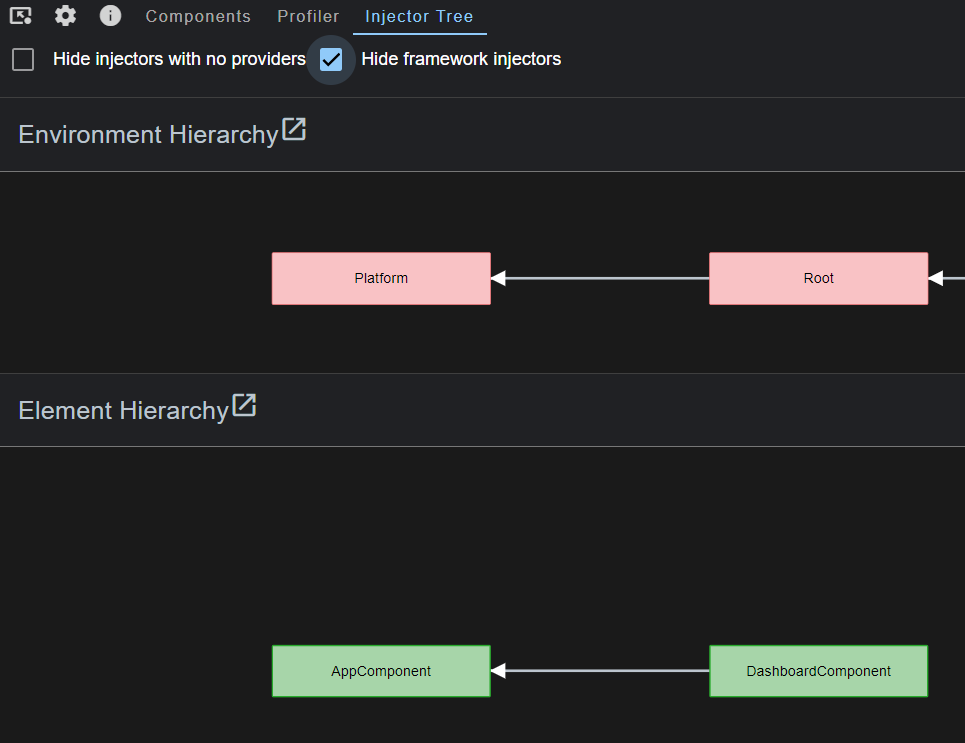
For a clearer view, we can check the option “hide framework injectors” to focus on our code:

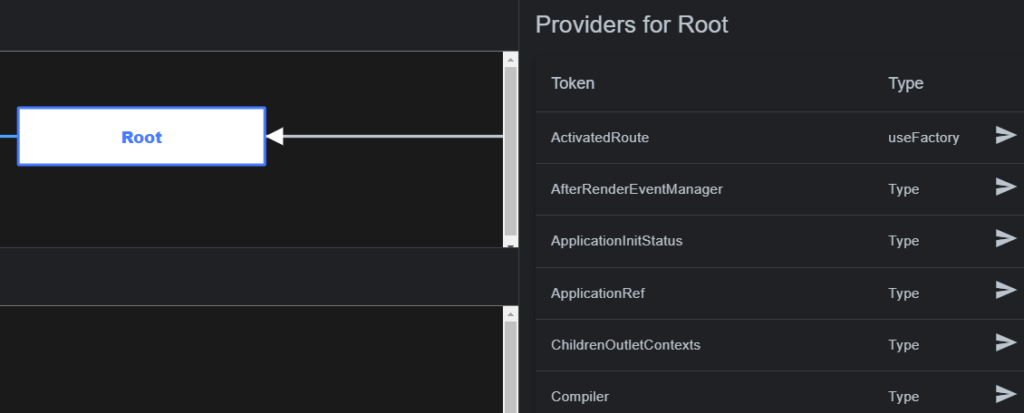
Clicking on an injector (such as root) shows the list of all injectables/services available in that injector:

This new tab seems to be just getting started, and more information will be added later. Even though the Devtools is a browser extension, the Injector tree tab only works for apps using Angular v17+. I tried an Angular v16 app with no success.

Browser dev tools for LocalStorage

Last week, I introduced localStorage and sessionStorage. I also suggested a few options to get notifications when such storage gets updated.

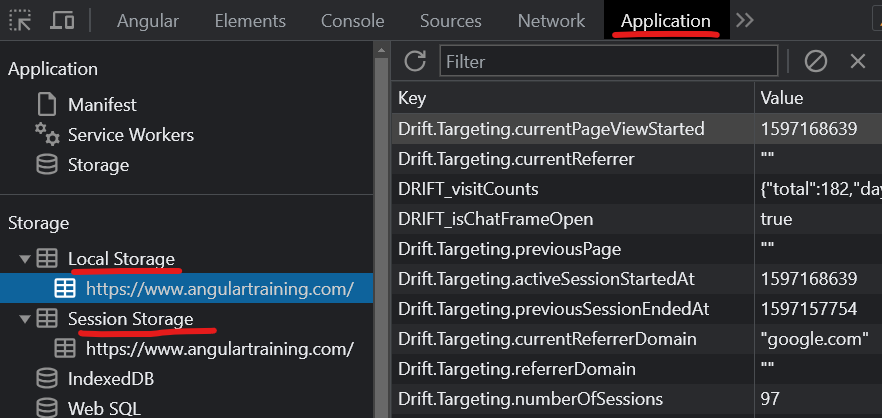
Today, I will cover how we can visualize and debug storage data. In Google Chrome, open the dev tools (right-click on the webpage, then “inspect” or press Ctrl + Shift + I).

Once the dev tools panel shows up, click on the “Application” tab:

You can select Local Storage or Session Storage on the left-hand side. This shows you the contents of those storages on the right-hand side in key-value pairs. Storage is by domain, so using those tools on a different website would show you different data.

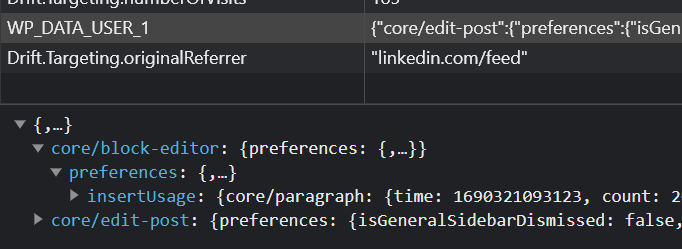
If an object is stored as a JSON string, you can click on the key-value row, and Chrome shows a collapsible version of that Javascript object at the bottom of the screen, making it easy to explore complex objects:

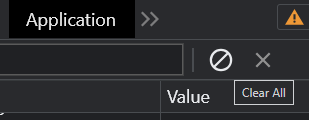
There are two buttons in the top right corner of that same panel. One allows you to clear the entire storage for the current domain, while the second one (the X) clears the currently selected key-value pair:

You can edit a key or value by double-clicking on the corresponding cell in the right panel’s table. This makes testing different values, resetting a cache, or debugging specific scenarios easy.

Rollbar: Error tracking and reporting

Whenever we deploy a web application to production, one of the challenges is that our code will run on several different machines in different locations. When a user reports an error, we cannot access their browser console or stack trace unless the user is techy enough to share that information with us.

Of course, we can create a generic error handler and try to reproduce an issue in our environment, but this can be challenging as none of these options give us eyes on what is going on in that user’s specific browser.

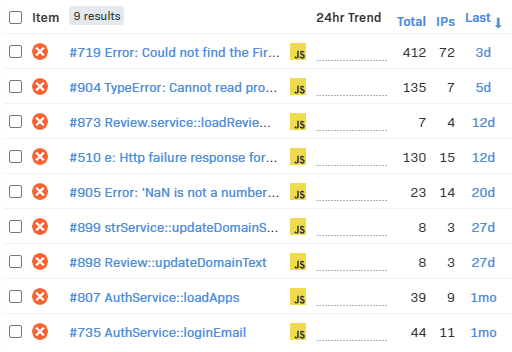
This is where Rollbar shines. Rollbar is a library that can report Javascript errors to a server and create alerts/statistics/tracking of those errors over time:

In the above screenshot alone, there is a wealth of information that we would never get with console.log. For instance, the first error has happened 412 times on 72 different machines (IPs), and the last occurrence was three days ago.

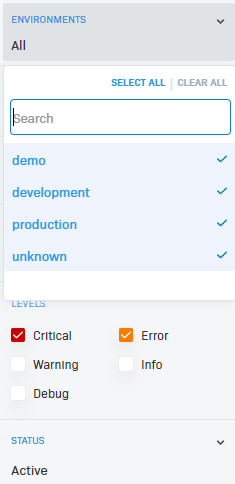
Such a screen can help you identify if a new release solved an issue for all users or created a new one. Even better, Rollbar supports different environments so you can check production or pre-prod, or staging environments for those errors, as well as filter by level, activity, etc. :

Each error contains the browser info, locale, screen definition, stack trace, and more. Errors can also be assigned to developers for further investigation and marked as fixed or muted if the error is irrelevant.

All in all, once people start using Rollbar, it’s almost impossible to stop using it. You can see an Angular demo on Stackblitz here and read this quick set-up tutorial from the Rollbar documentation.

Debugging with the ng namespace

Angular 9 introduced the ng namespace variable, which is available in development mode but not exposed when the application is running in production mode.

We can debug an application using that global namespace without any breakpoint or dev tools extension. Here’s how.

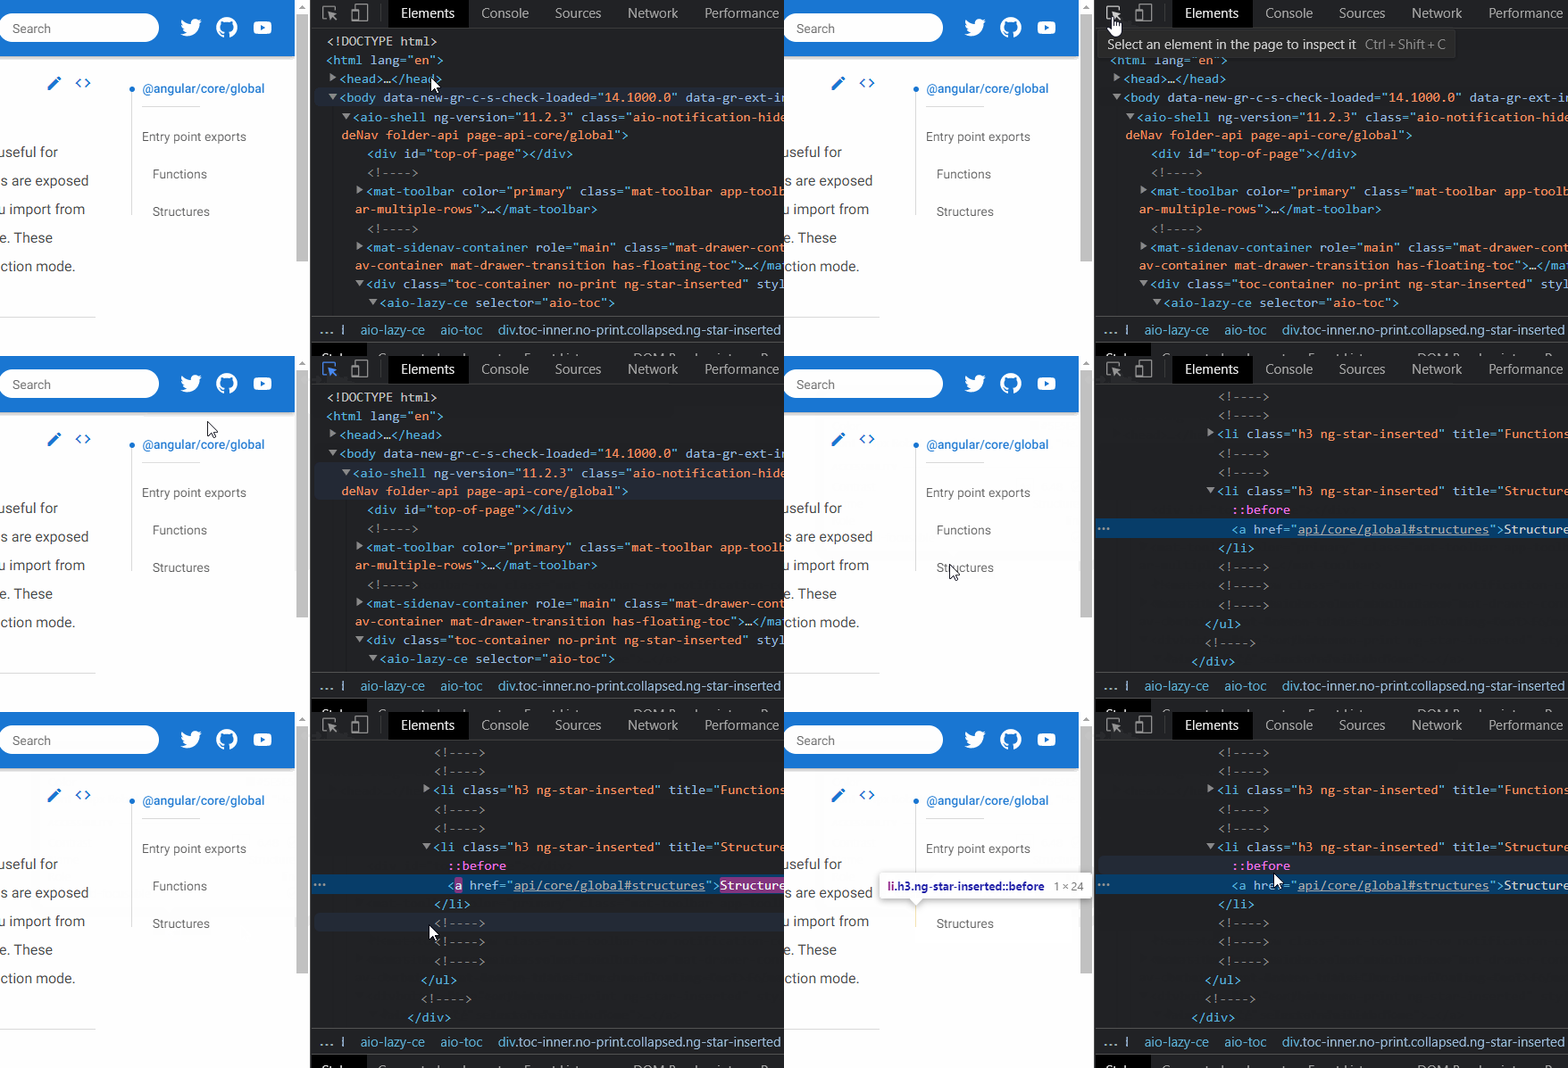
First, select a DOM element

Using your browser dev tools, select a DOM element on the page as follows:

When an element is selected using the above process, it becomes assigned to a variable called $0 in the developer tools console. The previous selection is known as $1, the one before that $2, and on and on.

Then, use the ng workspace functions

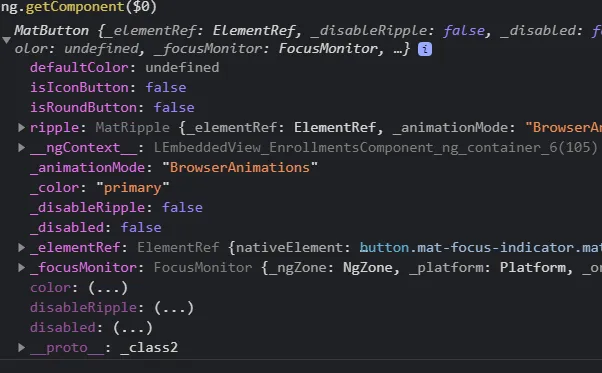
If the selected DOM element is an Angular component, you can head to the browser console and type ng.getComponent($0). This returns a reference to the component instance – ready to be explored and debugged:

If the element you select is not a component (say a div or an image), use ng.getOwningComponent($0) to get a reference to the parent component of the selected DOM element.

If you want to select the directives applied to that element, use ng.getDirectives($0). It’s also possible to access the context of a template in a ngFor or ngIf directive.

There are a few more useful functions available in that global namespace.

Angular DevTools Extension

Angular DevTools is a browser extension that provides debugging and profiling capabilities for Angular applications (v12 minimum). It’s available for Chrome, Firefox, and Edge.

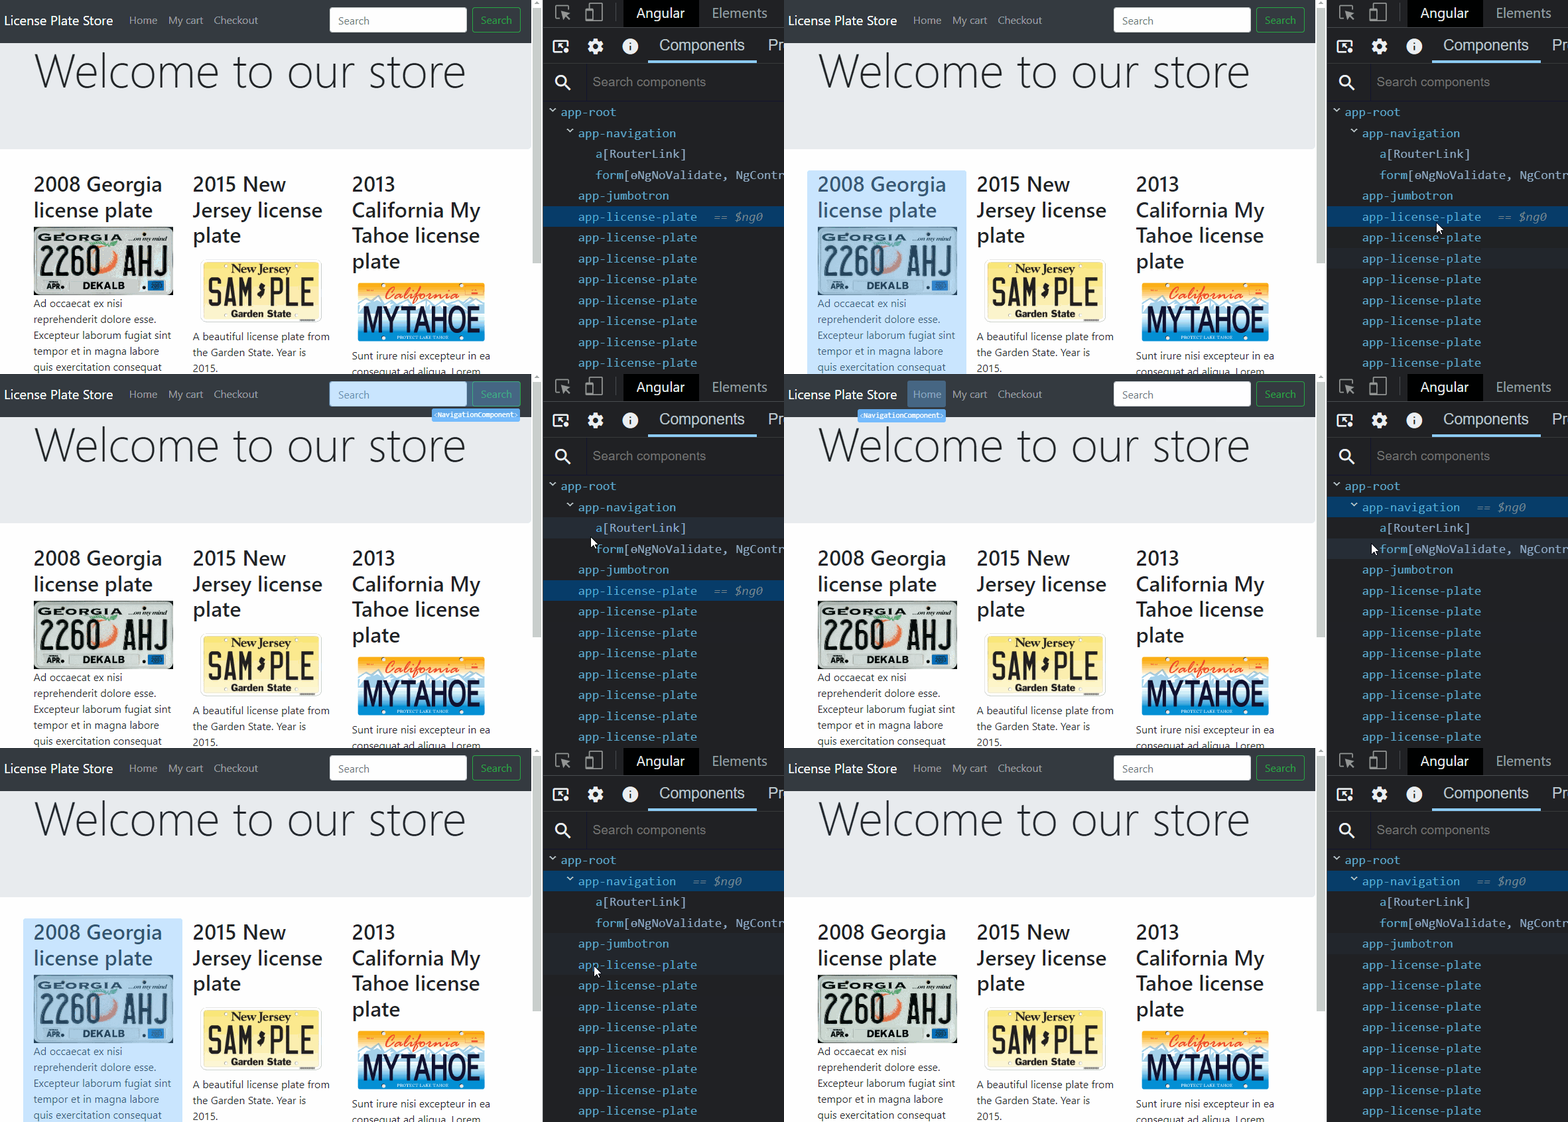
The extension comes with a tree view of the component hierarchy of our application. You can expand and collapse components to inspect their properties, inputs, and outputs. Hovering a component in the tree view highlights it in the user interface, as shown here:

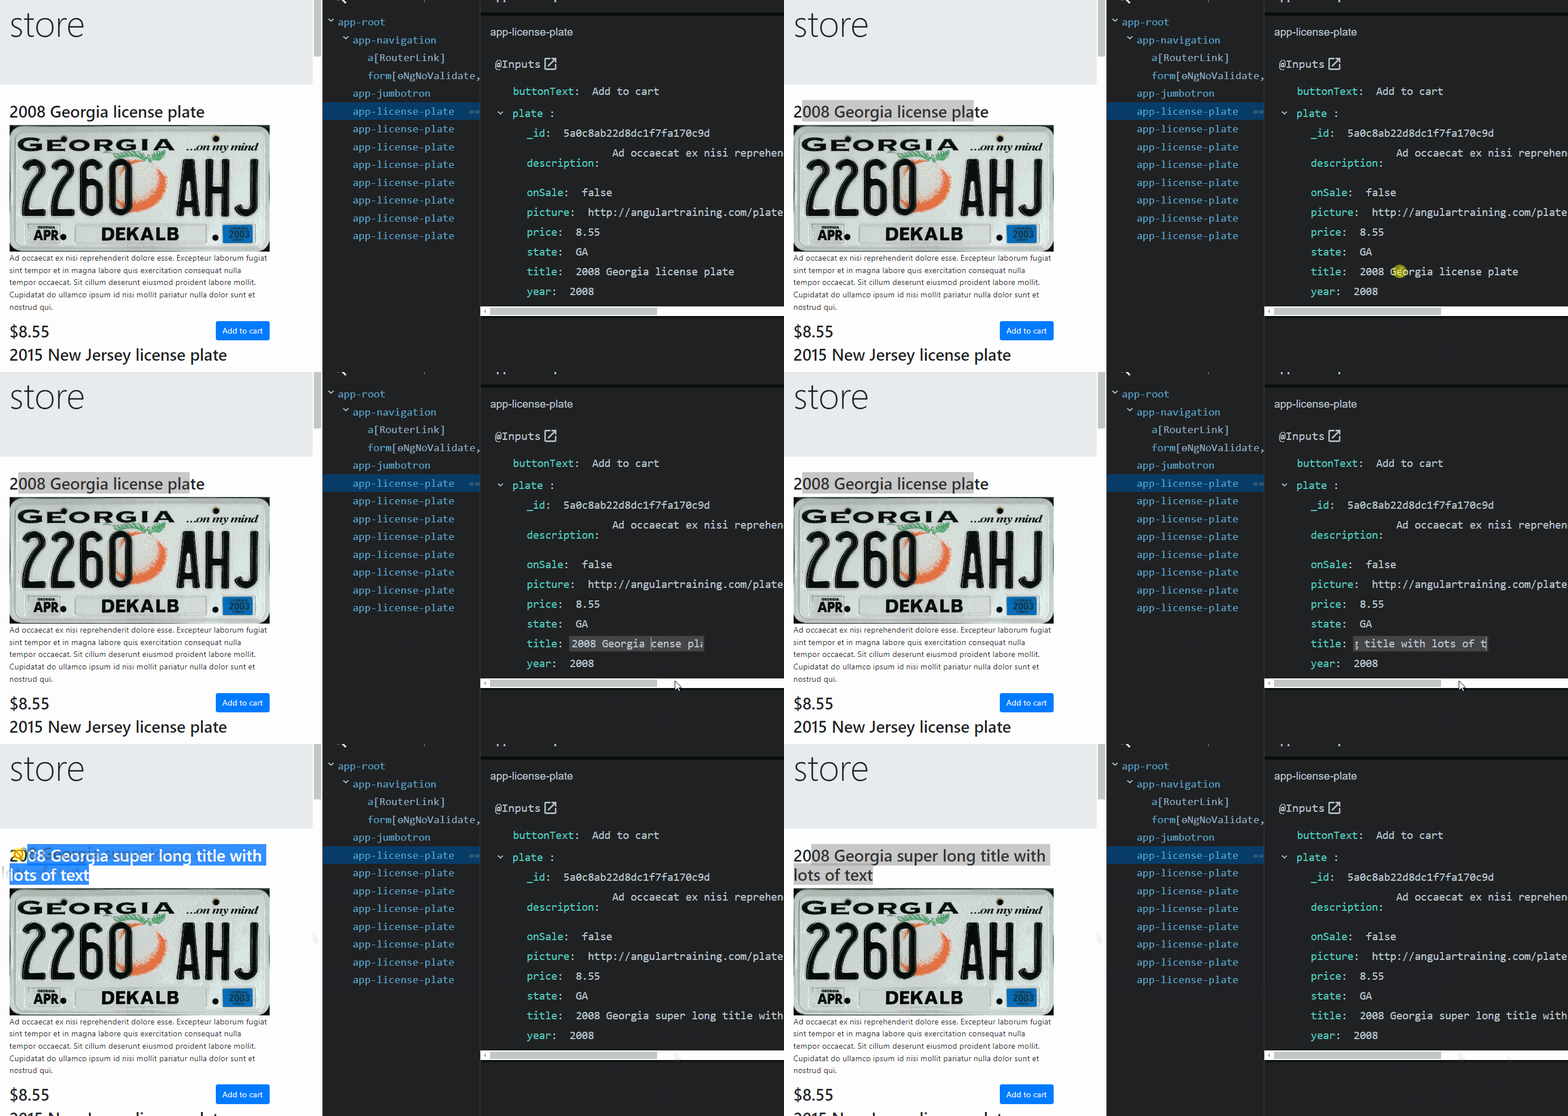
We can explore inputs and outputs and even change those values to test how the UI would respond to different values:

There’s also a search feature where you can type the name of a component to find it in a complex component hierarchy:

Those features alone can be a huge time saver—no need for debugger breakpoints or JSON pipe to inspect our data. The inspector always displays up-to-date component information.

The debugger keyword

Yesterday, we covered how to use the JSON pipe with a <pre> tag to debug JSON data on a web page.

Today, I want to cover one more debugging technique that is another time saver: The debugger keyword.

Whenever you want to add a breakpoint in your web application, add the Javascript instruction:

debugger;Code language: JavaScript (javascript)

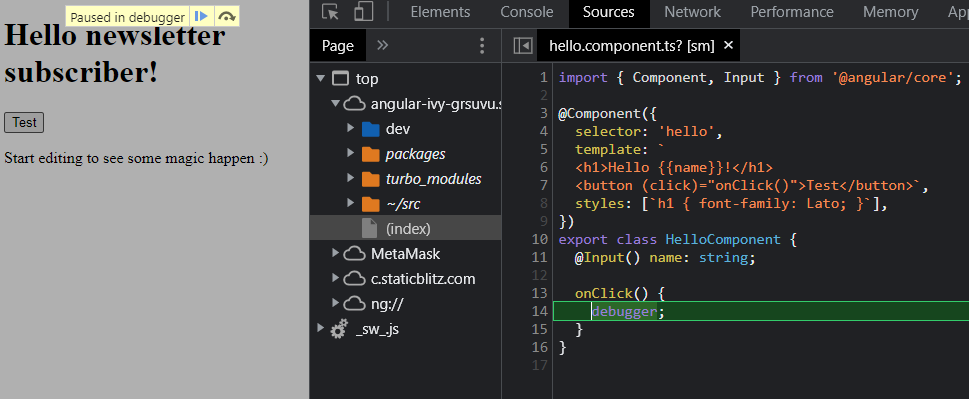
Then open the dev tools in your browser and navigate to your application URL. Whenever Javascript hits that debugger statement, the runtime will stop on that breakpoint, allowing you to debug your code:

Once the browser is paused on that breakpoint, you can add other breakpoints by clicking on the line numbers in the browser dev tools, just like regular debuggers work.

Two important things to note:

  1. The breakpoint works only when the dev tools are open
  2. Don’t forget to remove the debugger statement once you’re done debugging. You probably don’t want to ship that one to production.

Debugging with the JSON pipe

We have all used console.log at some point to debug our code. With Angular, there is an interesting alternative to display debugging information on our web page temporarily: The JSON pipe.

The primary usage is as follows:

<span>myData | json</span>Code language: HTML, XML (xml)

The above code will output your data as a JSON string in the span element, but it won’t be formatted, so the JSON string can be hard to read:

{"affiliation":"friendly","symbol":"Default Land Unit","echelon":"none","mod1":"None","mod2":"None","uniqueDesignation":"","higherFormation":"","reinforcedReduced":"","flying":false,"activity":false,"installation":false,"taskForce":false,"commandPost":"None","tacticalMissionTasks":"None","type":"Land Unit"}Code language: JavaScript (javascript)

Instead, the following syntax works a lot better:

<pre>myData | json</pre>Code language: HTML, XML (xml)

The pre HTML tag stands for “preformatted” content. As a result, that tag will preserve any whitespace, new lines, and tabs, which makes reading that JSON data a lot easier:

{
 "affiliation":"friendly",
 "symbol":"Default Land Unit",
 "echelon":"none",
 "mod1":"None",
 "mod2":"None"
}Code language: JavaScript (javascript)

It’s a simple trick, yet a big time saver when debugging code that’s using complex JSON structures.