Angular DevTools is a browser extension that provides debugging and profiling capabilities for Angular applications (v12 minimum). It’s available for Chrome, Firefox, and Edge.
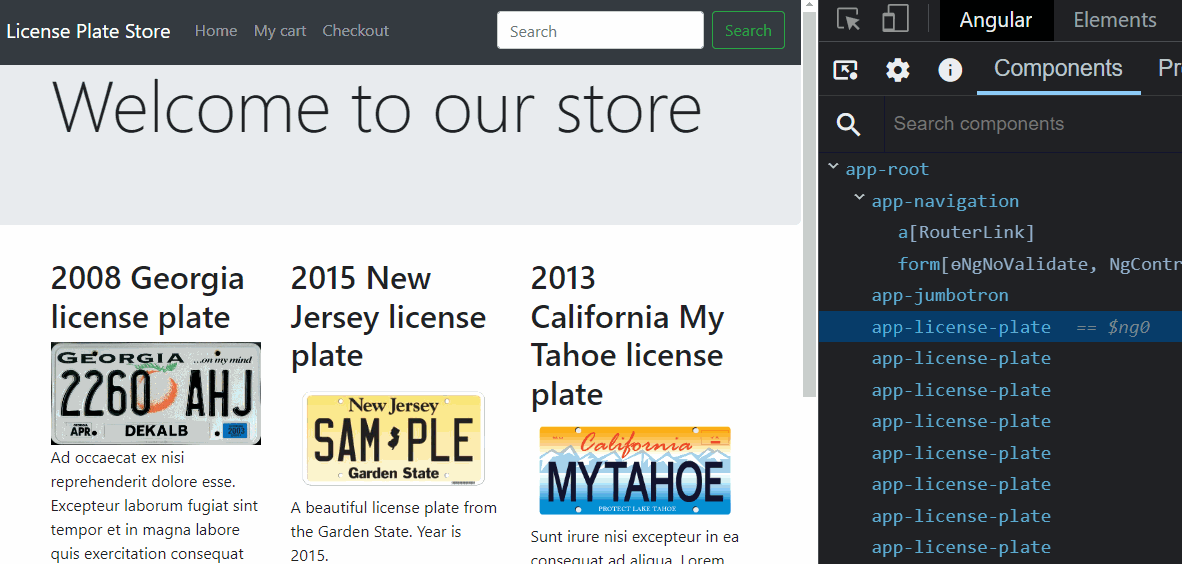
The extension comes with a tree view of the component hierarchy of our application. You can expand and collapse components to inspect their properties, inputs, and outputs. Hovering a component in the tree view highlights it in the user interface, as shown here:
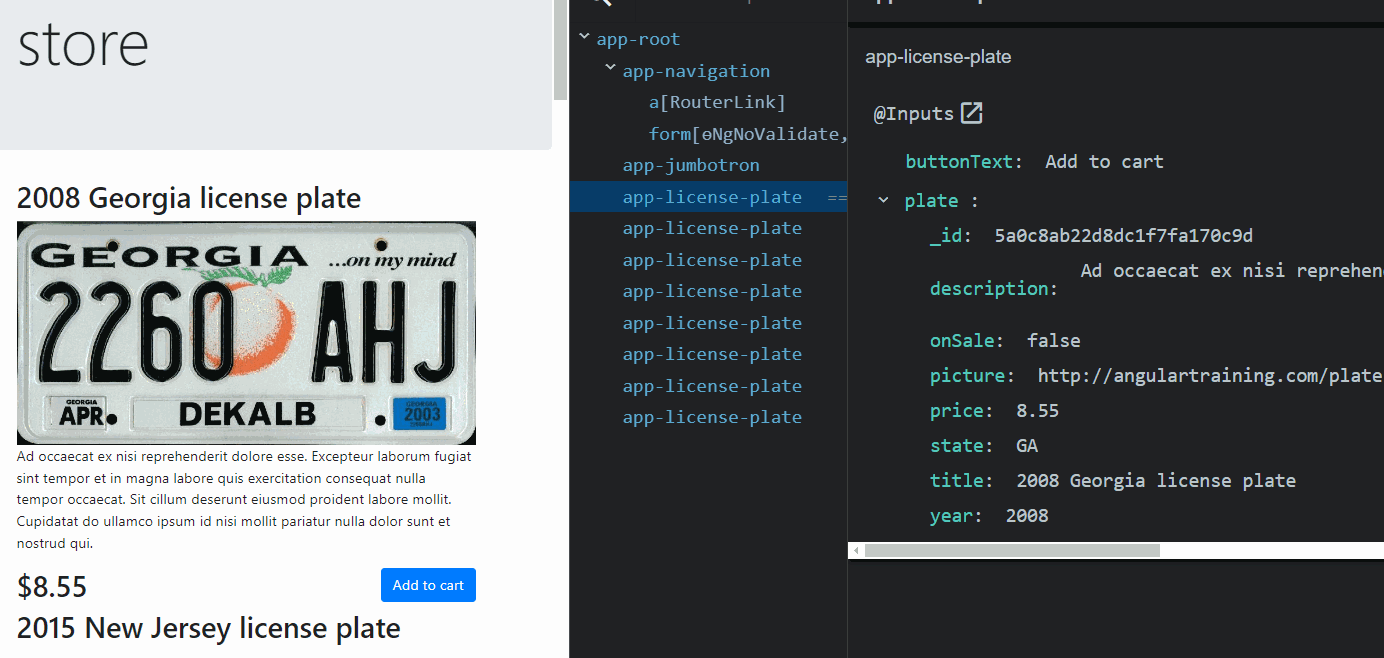
We can explore inputs and outputs and even change those values to test how the UI would respond to different values:
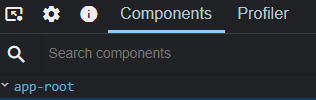
There’s also a search feature where you can type the name of a component to find it in a complex component hierarchy:
Those features alone can be a huge time saver—no need for debugger breakpoints or JSON pipe to inspect our data. The inspector always displays up-to-date component information.